Code
library(tidyverse)Video here
library(tidyverse)Run the code in the code chunk below to load the dataset happy_full.
# install.packages("remotes")
# remotes::install_github("matthewhirschey/tidybiology", force = TRUE)
# can also use devtools::install_github() since devtools is installed in
# system library
library(tidybiology)
data(happy_full)
happy_full |>
DT::datatable()region entry that is NOT equal to either "Western Europe" or "Central and Eastern Europe".happy_full |>
filter(!region %in% c("Western Europe", "Central and Eastern Europe")) -> ans1
ggplot(ans1, aes(x = fct_infreq(region))) +
geom_bar(fill = "darkgreen", color = "black") +
coord_flip() +
theme_classic() +
labs(x = "")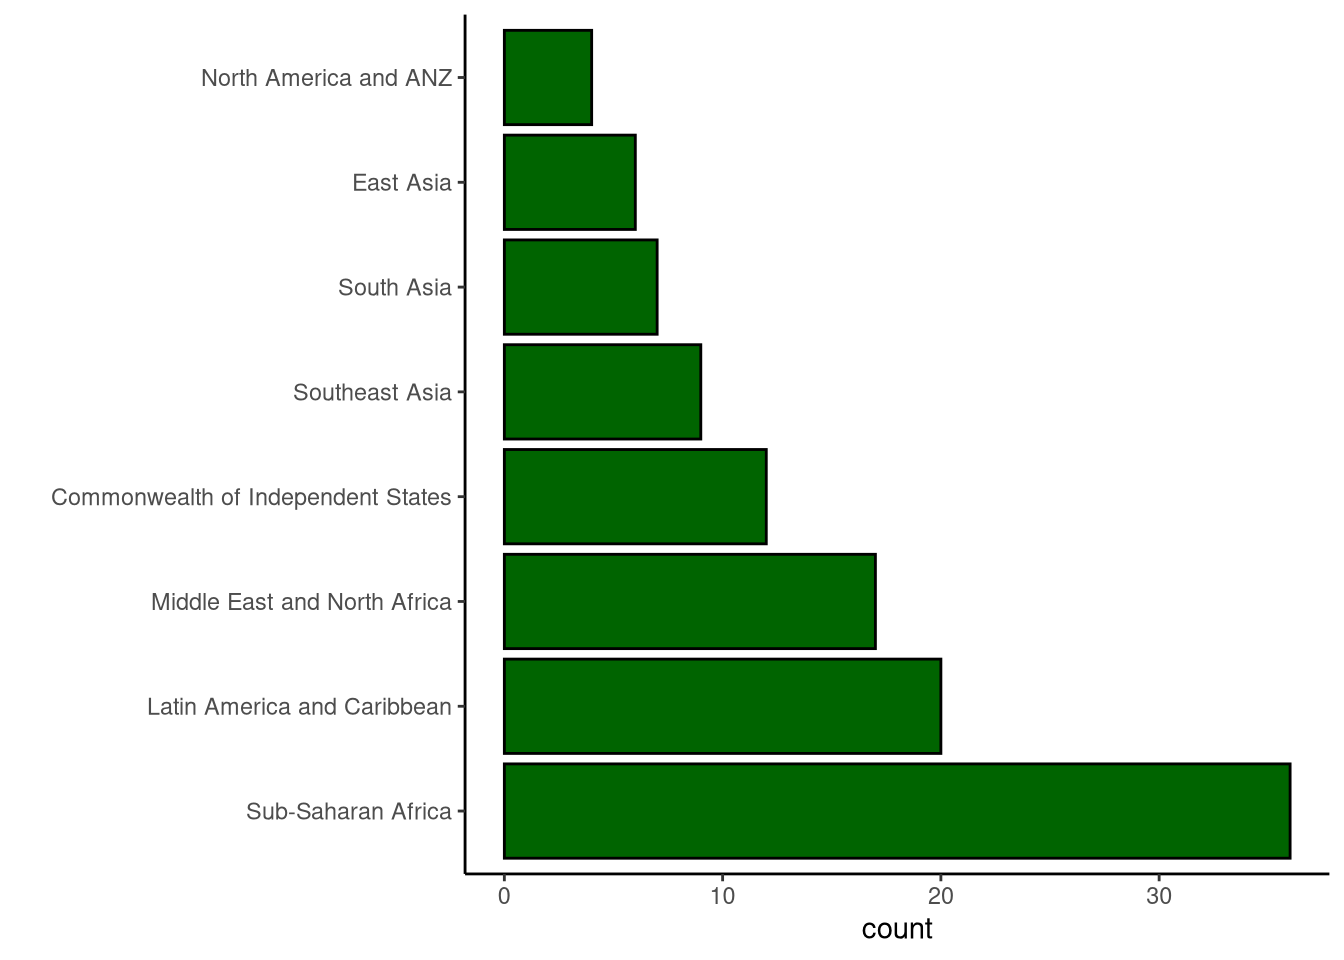
healthy_life_expectancy or above average generosity score).happy_full |>
filter(!(
healthy_life_expectancy > mean(healthy_life_expectancy) |
generosity > mean(generosity)
)) -> ans3
dim(ans3)[1] 27 20# This is the same as
happy_full |>
filter((
healthy_life_expectancy <= mean(healthy_life_expectancy) &
generosity <= mean(generosity)
)) -> ans4
dim(ans4)[1] 27 20ladder_score above 7, and have a healthy_life_expectancy above 70.happy_full |>
filter((
region %in% c("Western Europe", "Central and Eastern Europe") |
ladder_score > 7
) & healthy_life_expectancy > 70) -> ans5
ans5 |>
relocate(region, ladder_score, healthy_life_expectancy) |>
DT::datatable()# Note this is not the same as:
happy_full |>
filter(
healthy_life_expectancy > 70 &
ladder_score > 7 |
region %in% c("Western Europe", "Central and Eastern Europe")
) -> ans6
ans6 |>
relocate(region, ladder_score, healthy_life_expectancy) |>
DT::datatable()# To make the last bit of code work use parentheses as follows:
happy_full |>
filter(healthy_life_expectancy > 70 &
(
ladder_score > 7 |
region %in% c("Western Europe", "Central and Eastern Europe")
)) -> ans6a
ans6a |>
relocate(region, ladder_score, healthy_life_expectancy) |>
DT::datatable()generosity score that is between the median and mean generosity scores (inclusive) across all countries.happy_full |>
summarize(MD = median(generosity),
ME = mean(generosity))# A tibble: 1 × 2
MD ME
<dbl> <dbl>
1 -0.036 -0.0151# Note: Median < Mean
happy_full |>
filter(between(generosity, median(generosity), mean(generosity))) -> ans7
dim(ans7)[1] 8 20# Check
ans7 |>
reframe(R = range(generosity))# A tibble: 2 × 1
R
<dbl>
1 -0.036
2 -0.016# Another solution
happy_full |>
filter(generosity >= median(generosity),
generosity <= mean(generosity)) -> ans8
dim(ans8)[1] 8 20ladder_score is equal to the mean ladder_score \(\pm\) the standard error (SE = \(s/\sqrt{n}\)) of ladder_score across all countries.happy_full |>
summarize(xbar = mean(ladder_score),
SE = sd(ladder_score) / sqrt(sum(!is.na(ladder_score)))) -> ans8
ans8# A tibble: 1 × 2
xbar SE
<dbl> <dbl>
1 5.53 0.0880# Using between() with filter
happy_full |>
filter(between(
ladder_score,
mean(ladder_score) - sd(ladder_score) / sqrt(sum(!is.na(ladder_score))),
mean(ladder_score) + sd(ladder_score) / sqrt(sum(!is.na(ladder_score)))
)) -> ans9
dim(ans9)[1] 7 20# Using logical operators with filter
happy_full |>
filter(
ladder_score >= mean(ladder_score) - sd(ladder_score) / sqrt(sum(!is.na(ladder_score))) &
ladder_score <= mean(ladder_score) + sd(ladder_score) / sqrt(sum(!is.na(ladder_score)))
) -> ans10
dim(ans10)[1] 7 20# Using near() with filter
happy_full |>
filter(near(
ladder_score,
mean(ladder_score),
tol = sd(ladder_score) / sqrt(sum(!is.na(ladder_score)))
)) -> ans11
dim(ans11)[1] 7 20