library(tidyverse)
library(palmerpenguins)
# Your R Code here1 Exercises (Chapter 1)
How many rows are in
penguins? How many columns?What does the
bill_depth_mmvariable in thepenguinsdata frame describe? Read the help for?penguinsto find out.Make a scatterplot of
bill_depth_mmvs.bill_length_mm. That is, make a scatterplot withbill_depth_mmon the y-axis andbill_length_mmon the x-axis. Describe the relationship between these two variables.What happens if you make a scatterplot of
speciesvs.bill_depth_mm? What might be a better choice of geom?Why does the following give an error and how would you fix it?
library(tidyverse) ggplot(data = penguins) + geom_point()What does the
na.rmargument do ingeom_point()? What is the default value of the argument? Create a scatterplot where you successfully use this argument set toTRUE.Add the following caption to the plot you made in the previous exercise: “Data come from the
palmerpenguinspackage.” Hint: Take a look at the documentation forlabs().Recreate the following visualization. What aesthetic should
bill_depth_mmbe mapped to? And should it be mapped at the global level or at the geom level?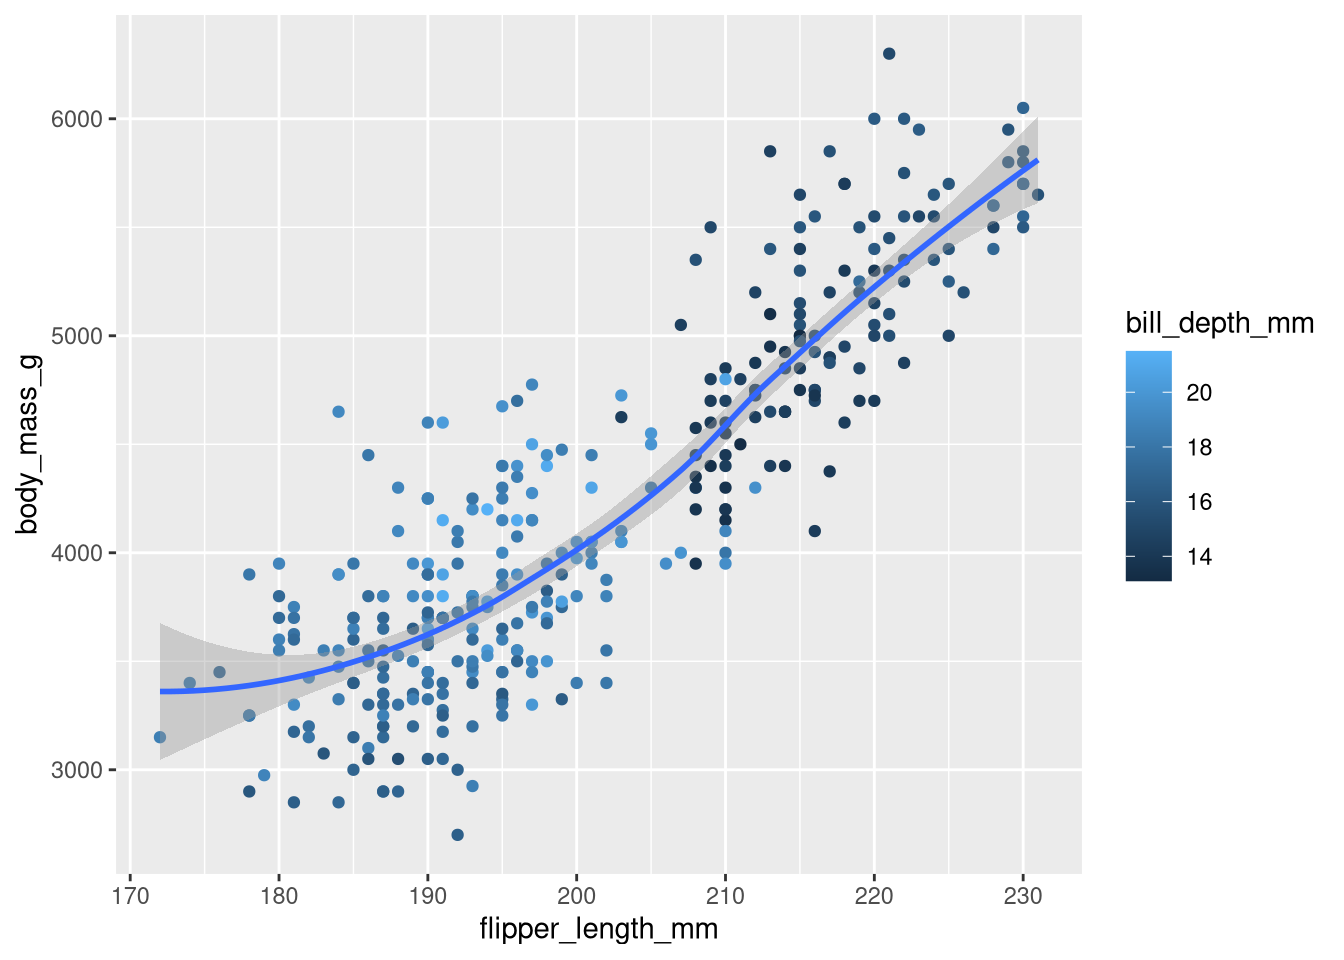
Run this code in your head and predict what the output will look like. Then, run the code in R and check your predictions.
ggplot( data = penguins, mapping = aes(x = flipper_length_mm, y = body_mass_g, color = island) ) + geom_point() + geom_smooth(se = FALSE)Will these two graphs look different? Why/why not?
ggplot( data = penguins, mapping = aes(x = flipper_length_mm, y = body_mass_g) ) + geom_point() + geom_smooth() ggplot() + geom_point( data = penguins, mapping = aes(x = flipper_length_mm, y = body_mass_g) ) + geom_smooth( data = penguins, mapping = aes(x = flipper_length_mm, y = body_mass_g) )Make a bar plot of
speciesofpenguins, where you assignspeciesto theyaesthetic. How is this plot different?How are the following two plots different? Which aesthetic,
colororfill, is more useful for changing the color of bars?ggplot(penguins, aes(x = species)) + geom_bar(color = "red") ggplot(penguins, aes(x = species)) + geom_bar(fill = "red")Answerggplot(penguins, aes(x = species)) + geom_bar(color = "red") -> p1 ggplot(penguins, aes(x = species)) + geom_bar(fill = "red") -> p2 p1 + p2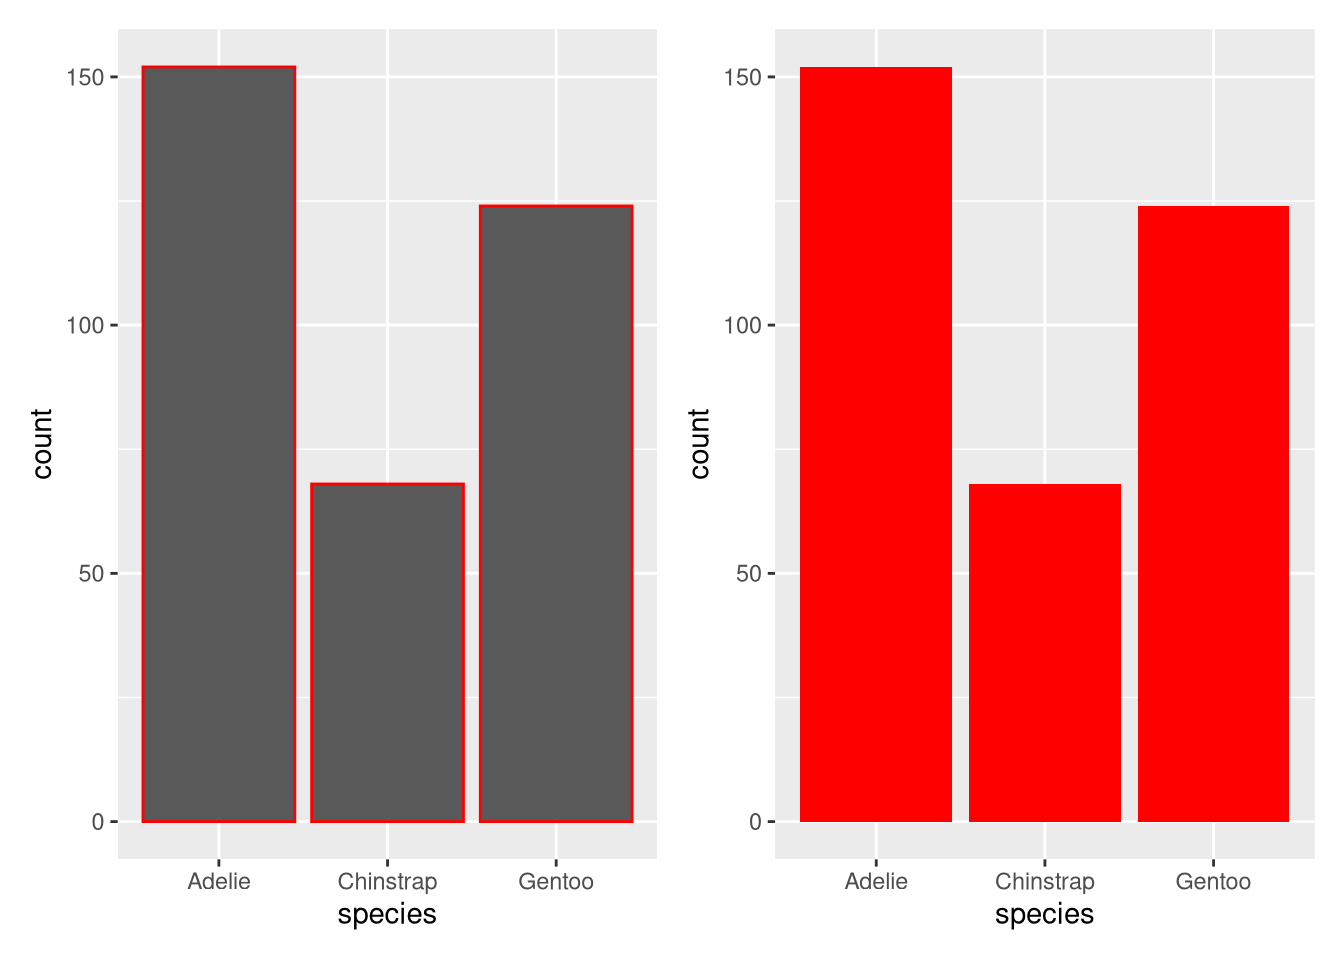
Your answer here.
What does the
binsargument ingeom_histogram()do?Make a histogram of the
caratvariable in thediamondsdataset that is available when you load thetidyversepackage. Experiment with different binwidths. What binwidth reveals the most interesting patterns?The
mpgdata frame that is bundled with theggplot2package contains 234 observations collected by the US Environmental Protection Agency on 38 car models. Which variables inmpgare categorical? Which variables are numerical? (Hint: Type?mpgto read the documentation for the dataset.) How can you see this information when you runmpg?Make a scatterplot of
hwyvs.displusing thempgdata frame. Next, map a third, numerical variable tocolor, thensize, then bothcolorandsize, thenshape. How do these aesthetics behave differently for categorical vs. numerical variables?In the scatterplot of
hwyvs.displ, what happens if you map a third variable tolinewidth?What happens if you map the same variable to multiple aesthetics?
Make a scatterplot of
bill_depth_mmvs.bill_length_mmand color the points byspecies. What does adding coloring by species reveal about the relationship between these two variables? What about faceting byspecies?Why does the following yield two separate legends? How would you fix it to combine the two legends?
ggplot( data = penguins, mapping = aes( x = bill_length_mm, y = bill_depth_mm, color = species, shape = species ) ) + geom_point() + labs(color = "Species")Create the two following stacked bar plots. Which question can you answer with the first one? Which question can you answer with the second one?
ggplot(penguins, aes(x = island, fill = species)) + geom_bar(position = "fill")ggplot(penguins, aes(x = species, fill = island)) + geom_bar(position = "fill")Answerggplot(penguins, aes(x = island, fill = species)) + geom_bar(position = "fill") -> p1 ggplot(penguins, aes(x = species, fill = island)) + geom_bar(position = "fill") -> p2 p1 / p2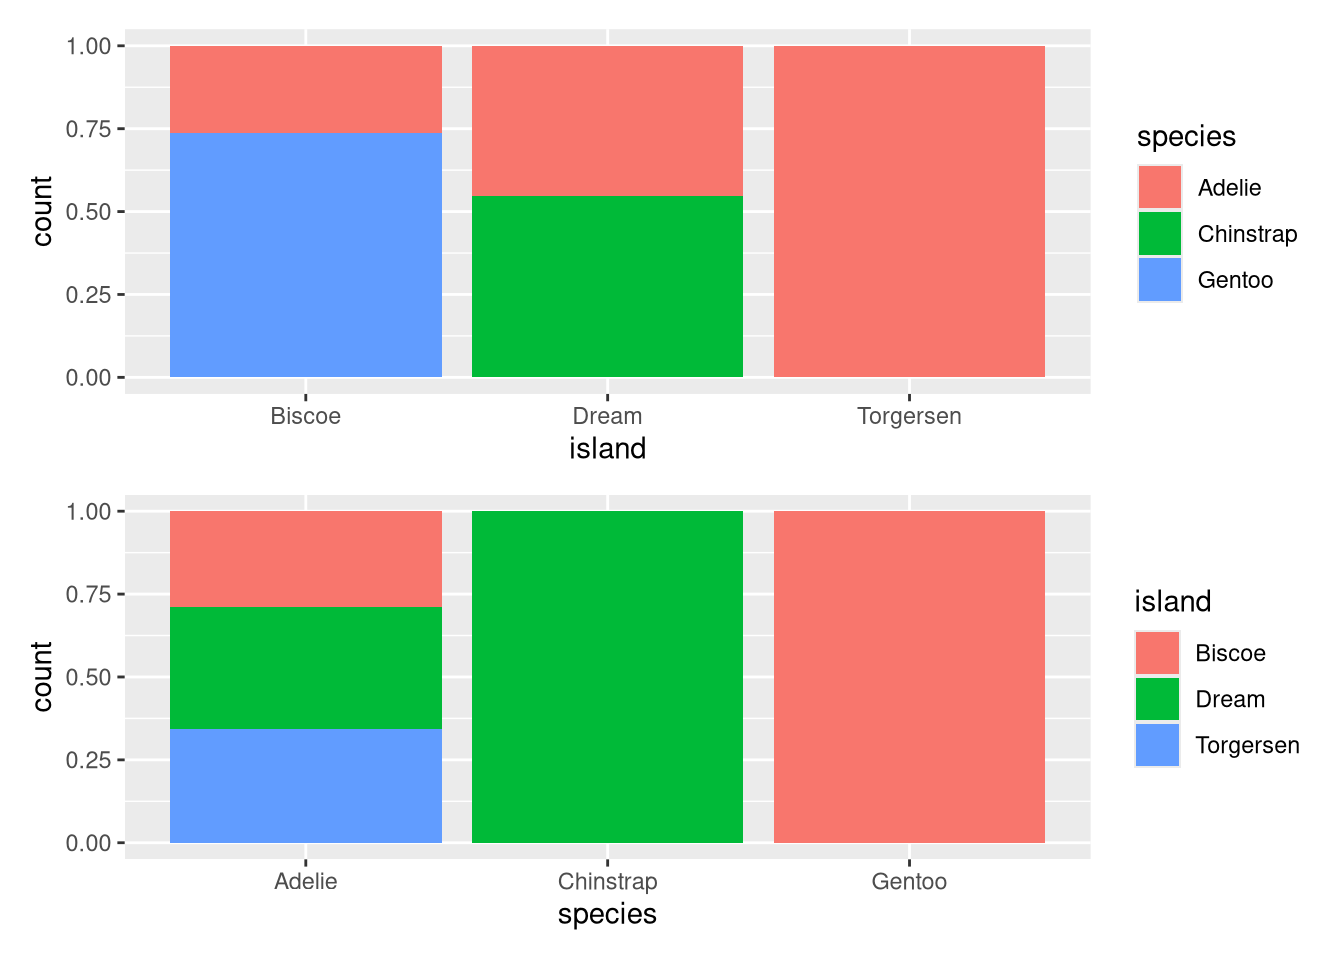
Your answer here.
Run the following lines of code. Which of the two plots is saved as
mpg-plot.png? Why?ggplot(mpg, aes(x = class)) + geom_bar() ggplot(mpg, aes(x = cty, y = hwy)) + geom_point() ggsave("mpg-plot.png")What do you need to change in the code above to save the plot as a PDF instead of a PNG? How could you find out what types of image files would work in
ggsave()?